Project Proposal
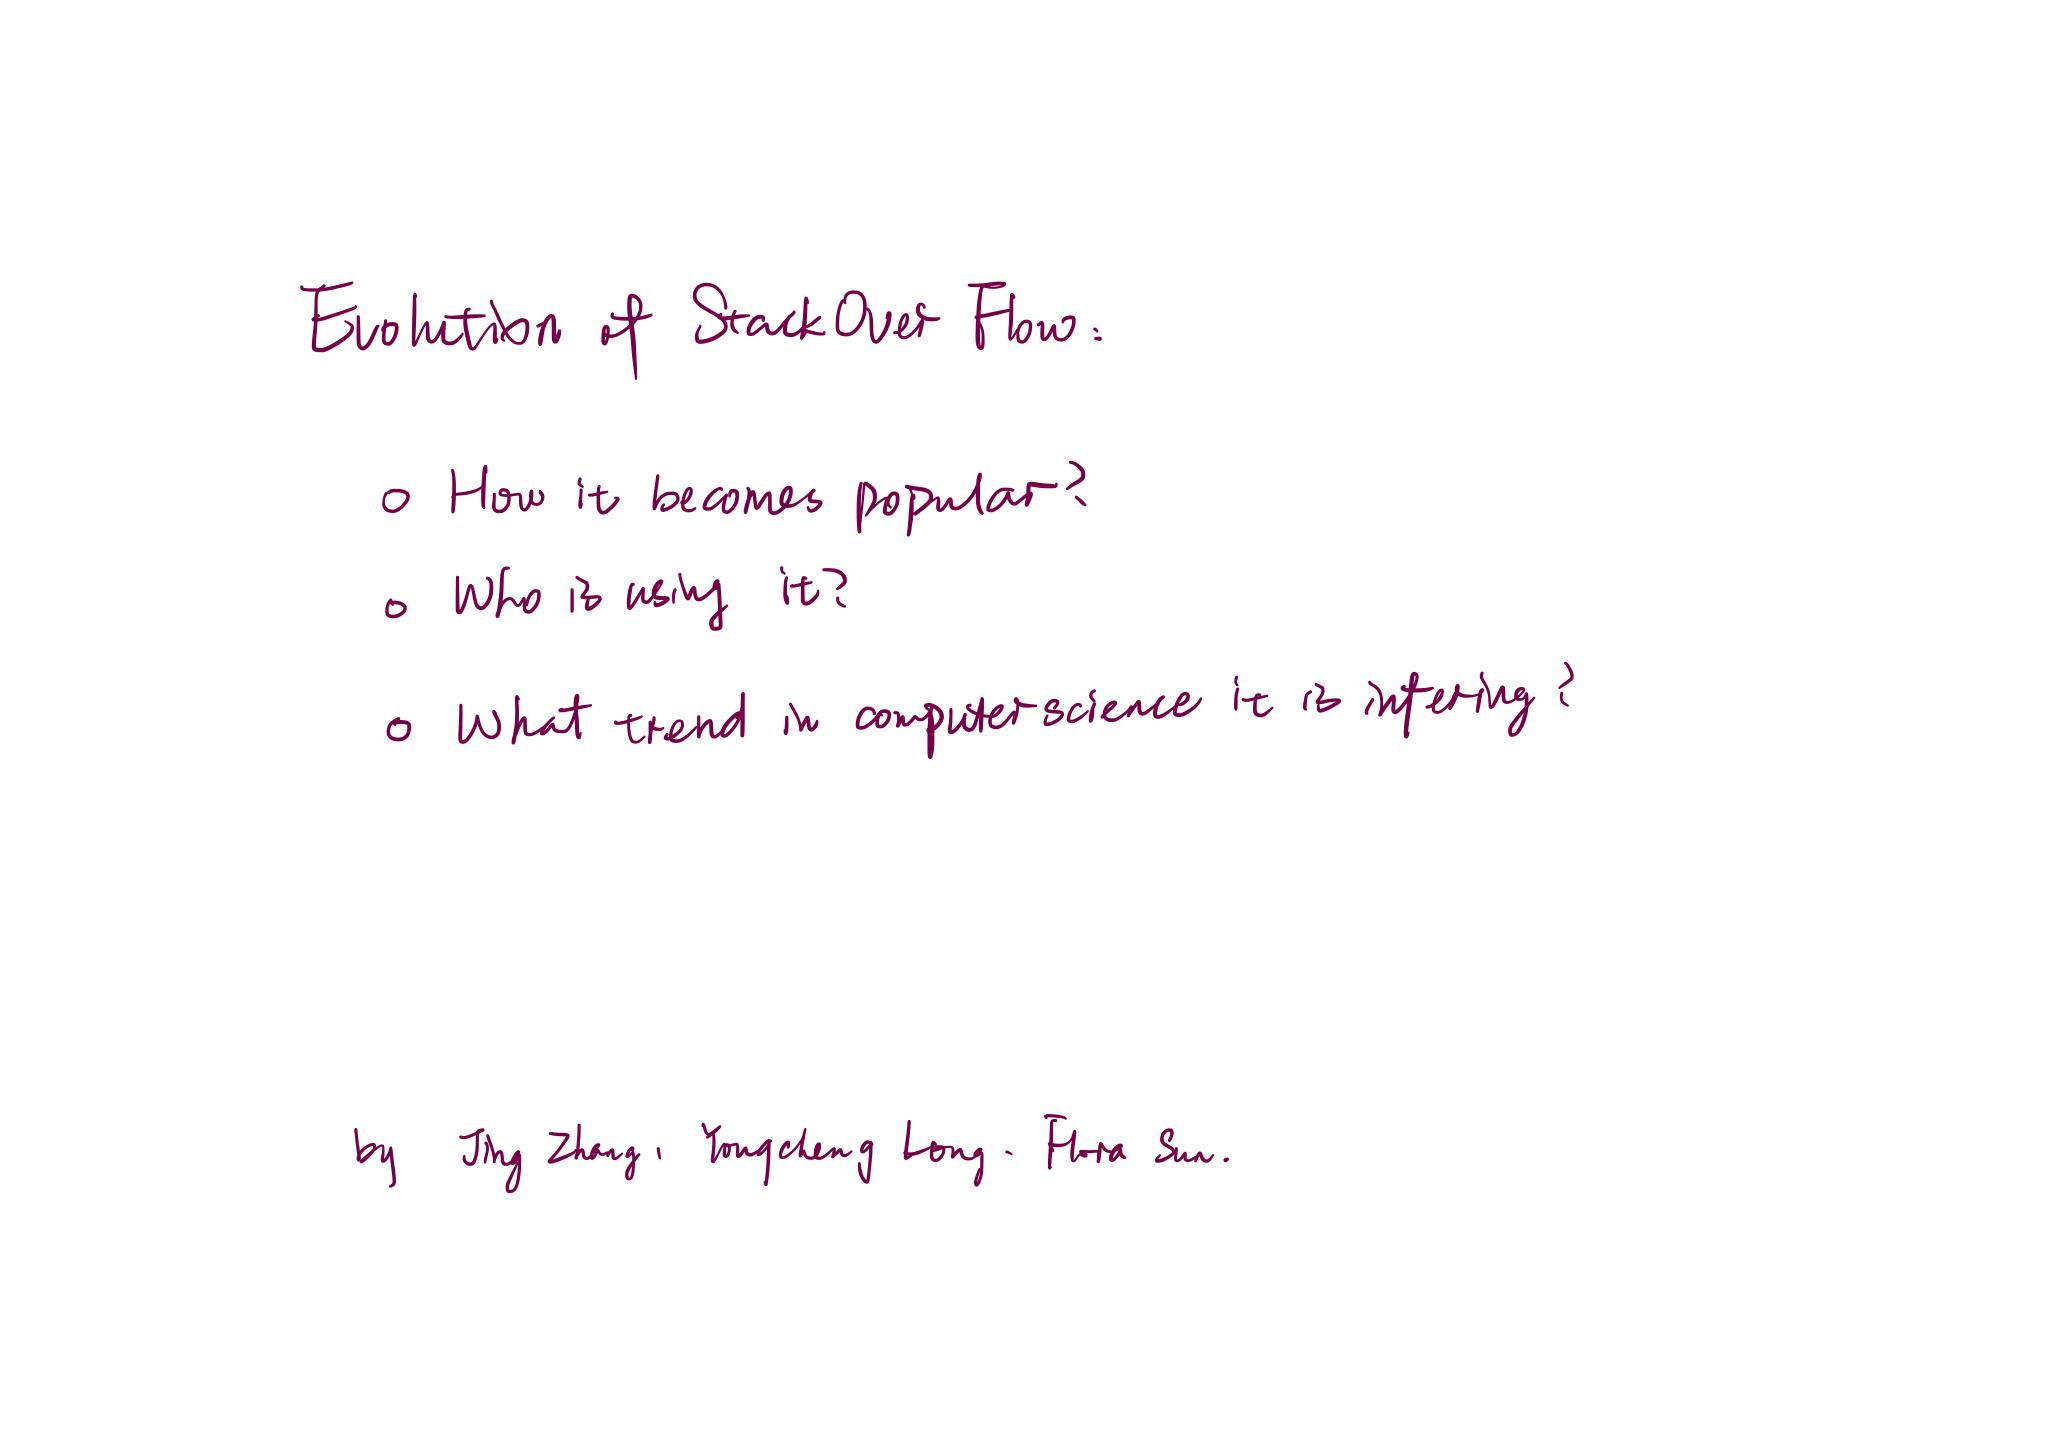
Title: Evolution of Stack Overflow
Members: Flora Sun, Jing Zhang, Yongcheng Long
Basic Info
Project title: Evolution of Stack Overflow
Emails and IDs:
- yongcheng.long@wustl.edu , 476433
- zjing@wustl.edu , 475536
- zhixin.sun@wustl.edu , 475178
Link to repo: https://github.com/ooorouge/ooorouge.github.io
Background and Motivation
Stack Overflow might be the world 's largest tech form that millions of users post their questions and answer others ’questions in one day, perhaps, we use it a lot to dig out solutions for it and might answer some of the questions. Since stack overflow was launched on September 15, 2008, it is quite an incredible accomplishment that it achieved. This is the reason why we ’d like to find out the evolution of stack overflow by users and posts in recent six years. In users ’perspective, we are curious about the bigger picture, finding out in recent six years how many users involved in using stack overflow, are they active or not and who are the most voted problem solvers. In posts ’perspective, we ’d like to know what are they related to by tags as well as the combinations of tags users used to categorize their questions.
Project Objectives
Primary questions
- Where are the users in recent years?
- Are they active or not?
- Who are the users with the highest level of reputation?
- What are the most popular tags used to categorize a question?
- What are the combinations of tags used to categorize a question?
- How many posts are made using this tag?
Benefits
By answering and visualizing these questions, we will know where users are and do they still have time to log into their accounts. Besides, we like to know who are the most ten voted users. We will also have a deep understanding of tech trends because we will dig out connections and will quantitatively show how many times a tag is used.
Data
Data Sources
Stack Overflow Insights
The annual developer survey data published by Stack Overflow: Stack Overflow Insights - Developer Hiring, Marketing, and User Research , from where we can obtain the location of the survey takers in recent 6 years (2015 - 2020) and plan to use the data in our GeoMap in user ’s page.
Kaggle
A kaggle dataset containing Stack Overflow posts ’and users ’information published by stackOverflow: Stack Overflow Data , from where we can obtain data such as each user ’s reputation, number of their up-votes and display name. They also provide access to post data, for instance, the tag for each post.
Stack Exchange Data Explorer
Used for query users who have most reputation at a given time, as well as number of new users and inactive users.
Data Processing
Users
- We need to count the number of users for each country.
- We need to abstract the reputation of the user from the kaggle dataset and sort it to abstract the top 10 users with highest reputations.
Posts
- We need to count the frequency of each tag in all those questions, and the time of each pair of tags is used in the same post. This can be computed by vector multiplication and addition. The diagonal element of the resulting matrix will be the frequency of the corresponding tag, while the off-diagonal elements represent the time of the corresponding pair of tags showing in the same question. Then we can transfer this matrix into the json we need for the visualization.
- The total number of posts each year.
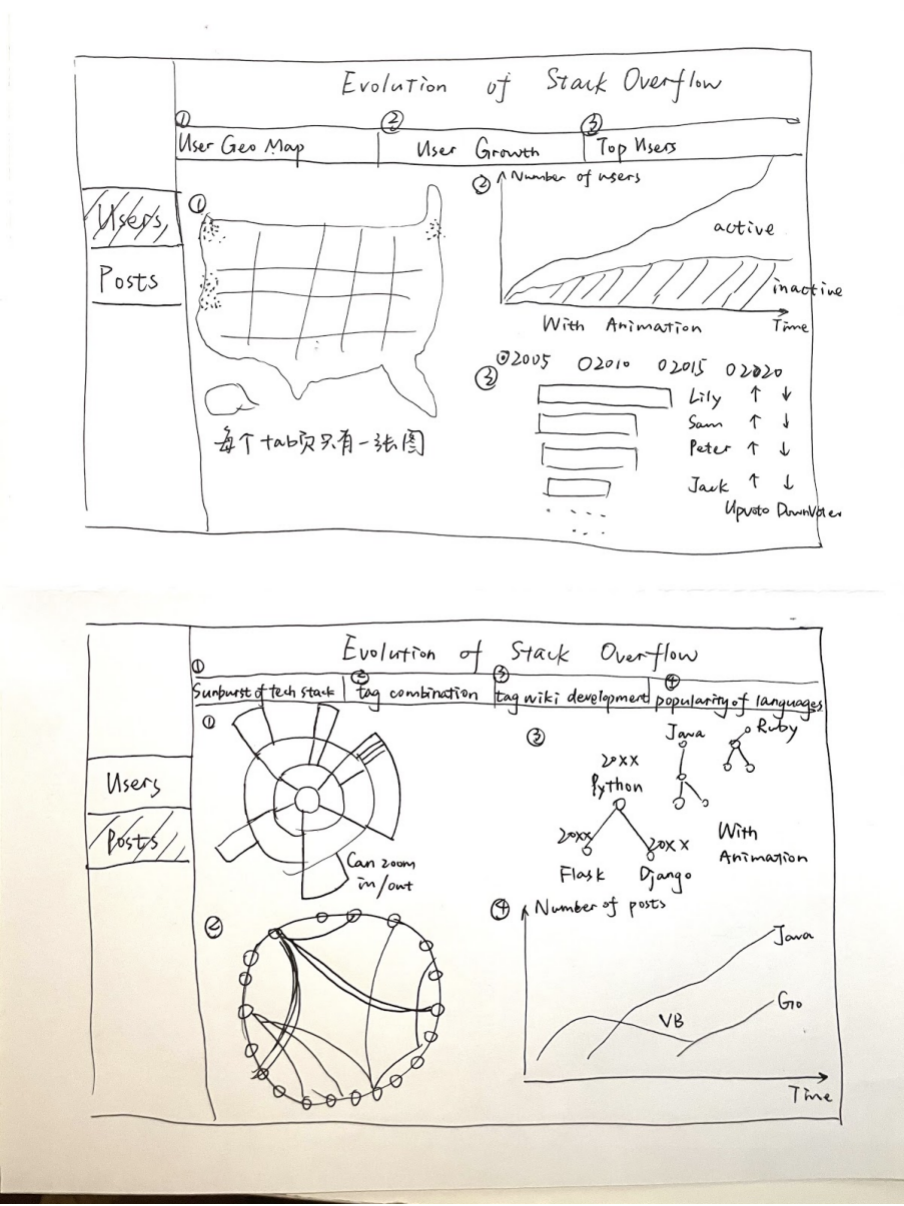
Visualization Design
We will display the user data and post data in two tab bars but they will share the same timeline with a brush to select a specific time range. To visualize the distribution of the users around the world, the main idea is to create a geo map. For the user growth, we want to show the number of active users and inactive users with the development of Stack Overflow. To display the users with a top level of reputation, treating them as entities is a good way to work on. When it comes to the most popular tags, it is similar to the top users we discussed earlier. To visualize the tag combinations, network is the common approach to show relationships. With regard to the development of tags, the focus is on the changes over time.
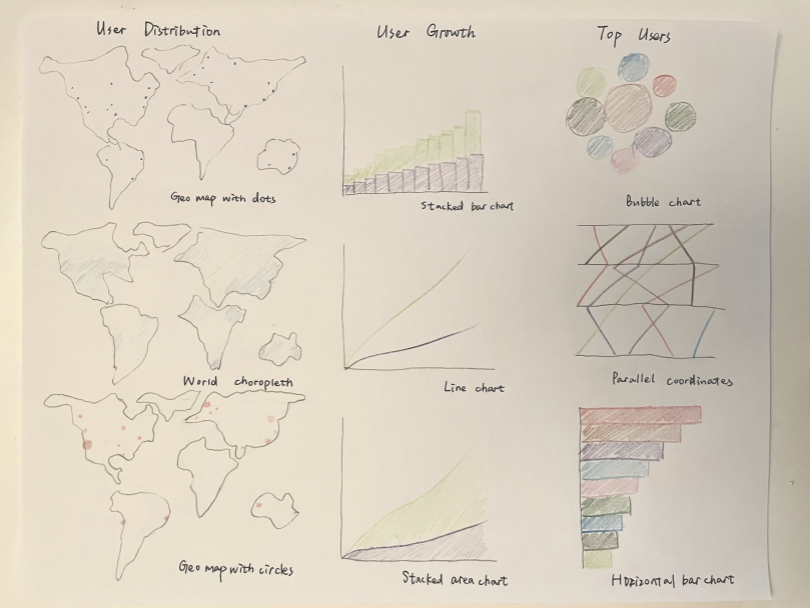
The alternatives designs for the questions we are interested in are as follows.
- User distribution around the world: Geo map with dots, world choropleth, geo map with circles
- User growth over time: Stacked bar chart, line chart, stacked area chart
- Users with top level of reputation: Bubble chart, parallel coordinates, horizontal bar chart
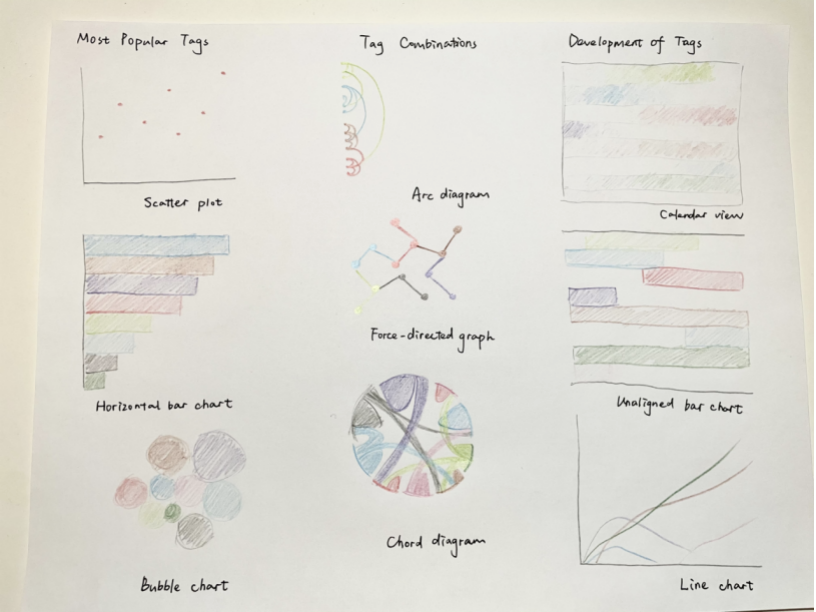
- Most popular tags in posts: Scatter plot, horizontal bar chart, bubble chart
- Tag combinations in posts: Arc diagram, force-directed graph, chord diagram
- Development of tags over time: Calendar view, unaligned bar chart, line chart
Prototype v1
Three alternatives for design
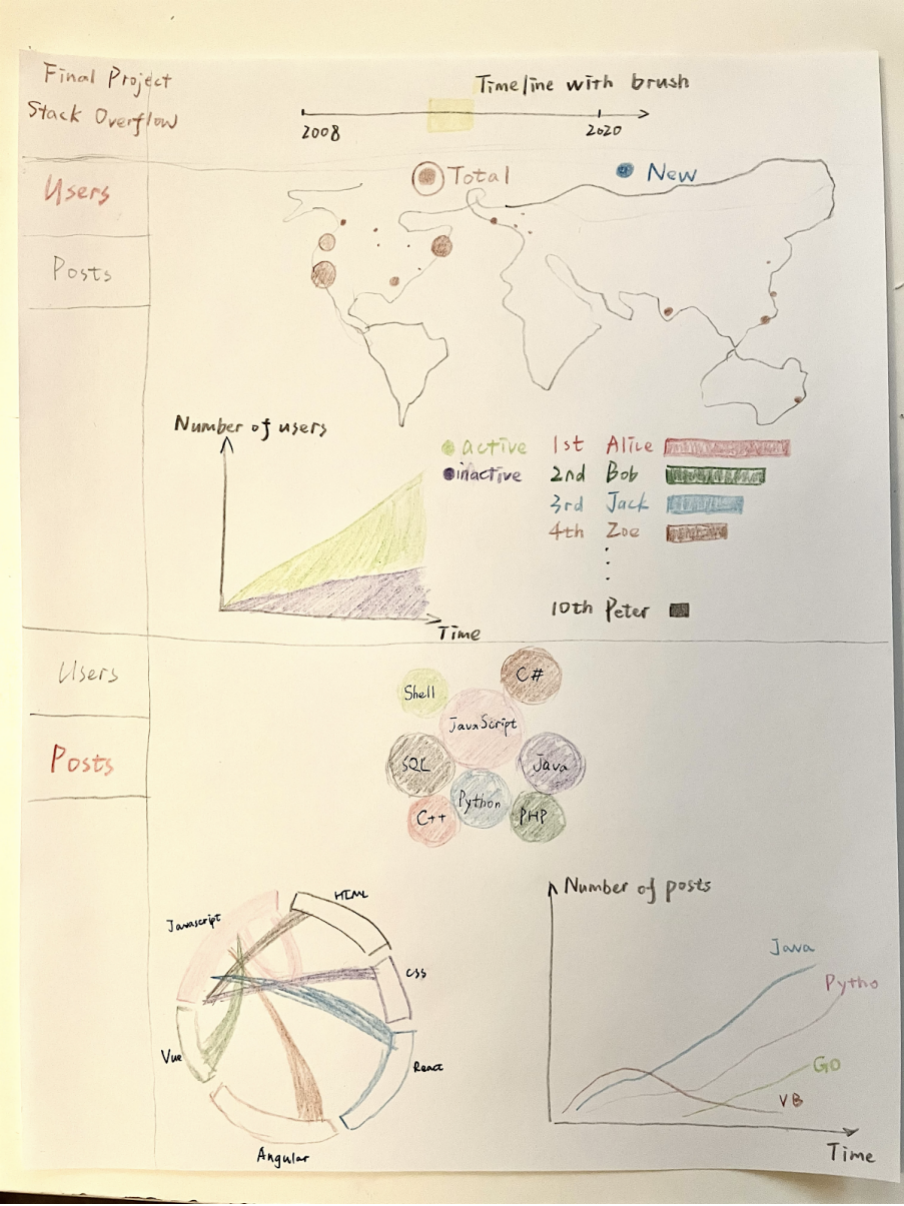
Final design
Minor Adjustment of Final design
A cover page is added to show the project theme and questions we are trying to answer
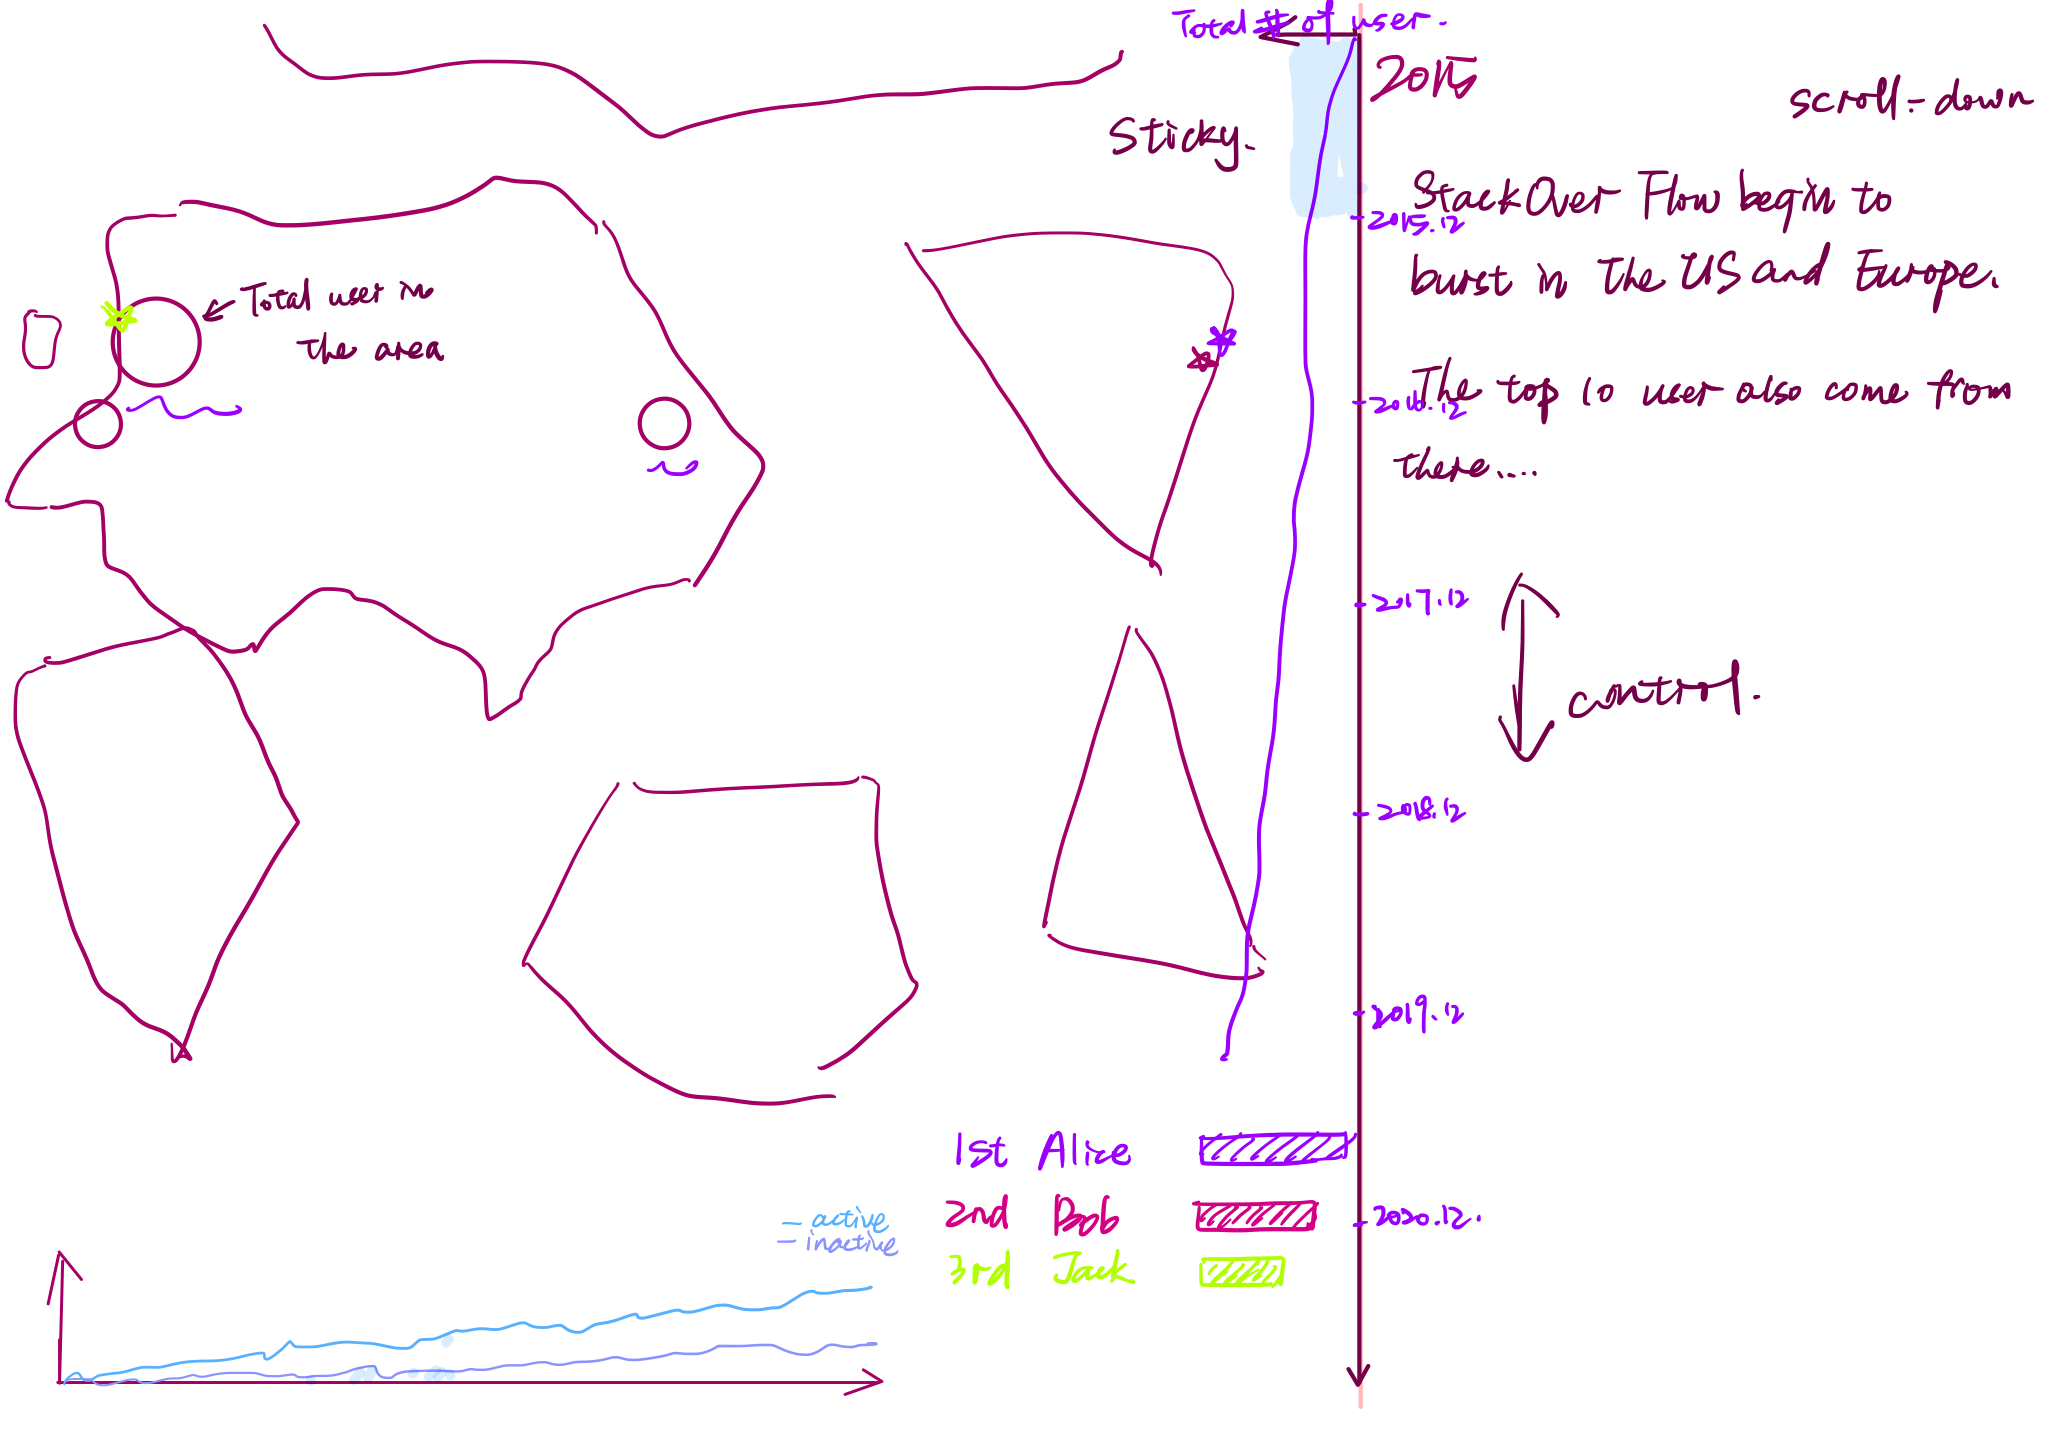
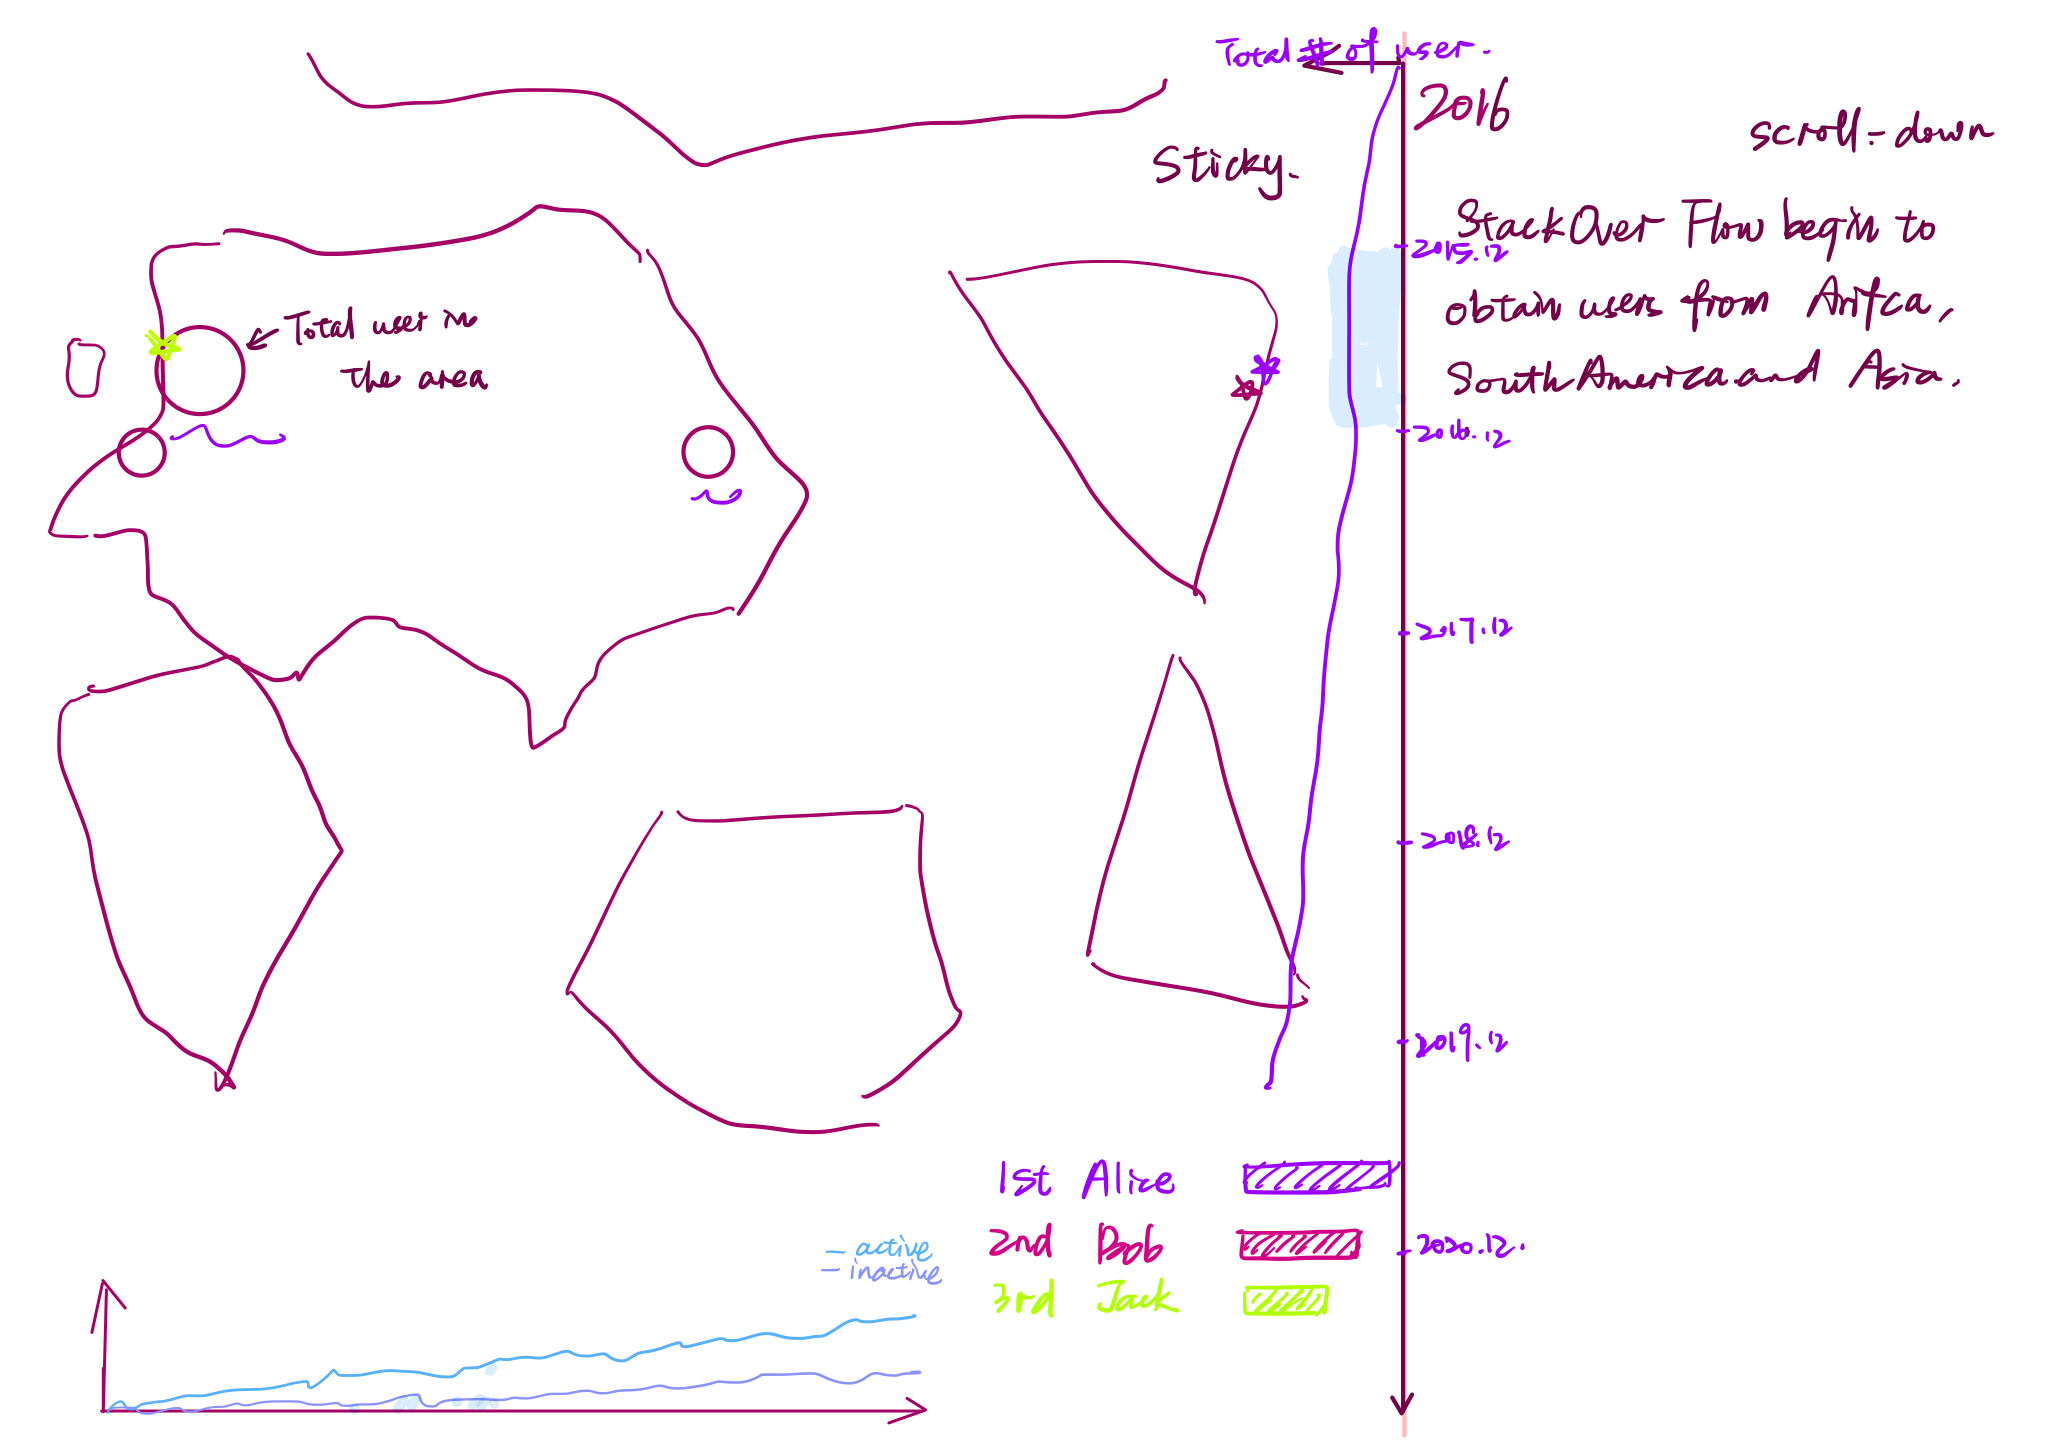
The users visualization becomes scrolling down
A framework called pudding can help us achieve this.
A transfer page is added to mark the tranfer from user data to post data
The post page basically remains the same
User distribution around the world
Visualization : geo map with circles
Visual encoding : longitude and latitude pair =>x and y, number of users =>circle size, newly / in total =>color
Reason : The area of a state or a country cannot represent the size of the population. It is better to append circles to the geo map.
User growth over time
Visualization : stacked area chart
Visual encoding : time =>x, number of users =>y, active / inactive =>color
Reason : Although we should set a time unit to organize the datum, the growth of users is a progress of gradual transition. Stacked area chart can be a better approach.
Users with top level of reputation
Visualization : horizontal bar chart
Visual encoding : reputation =>x, user =>y
Reason : Horizontal bar chart can help us compare the difference between these users with high reputation.
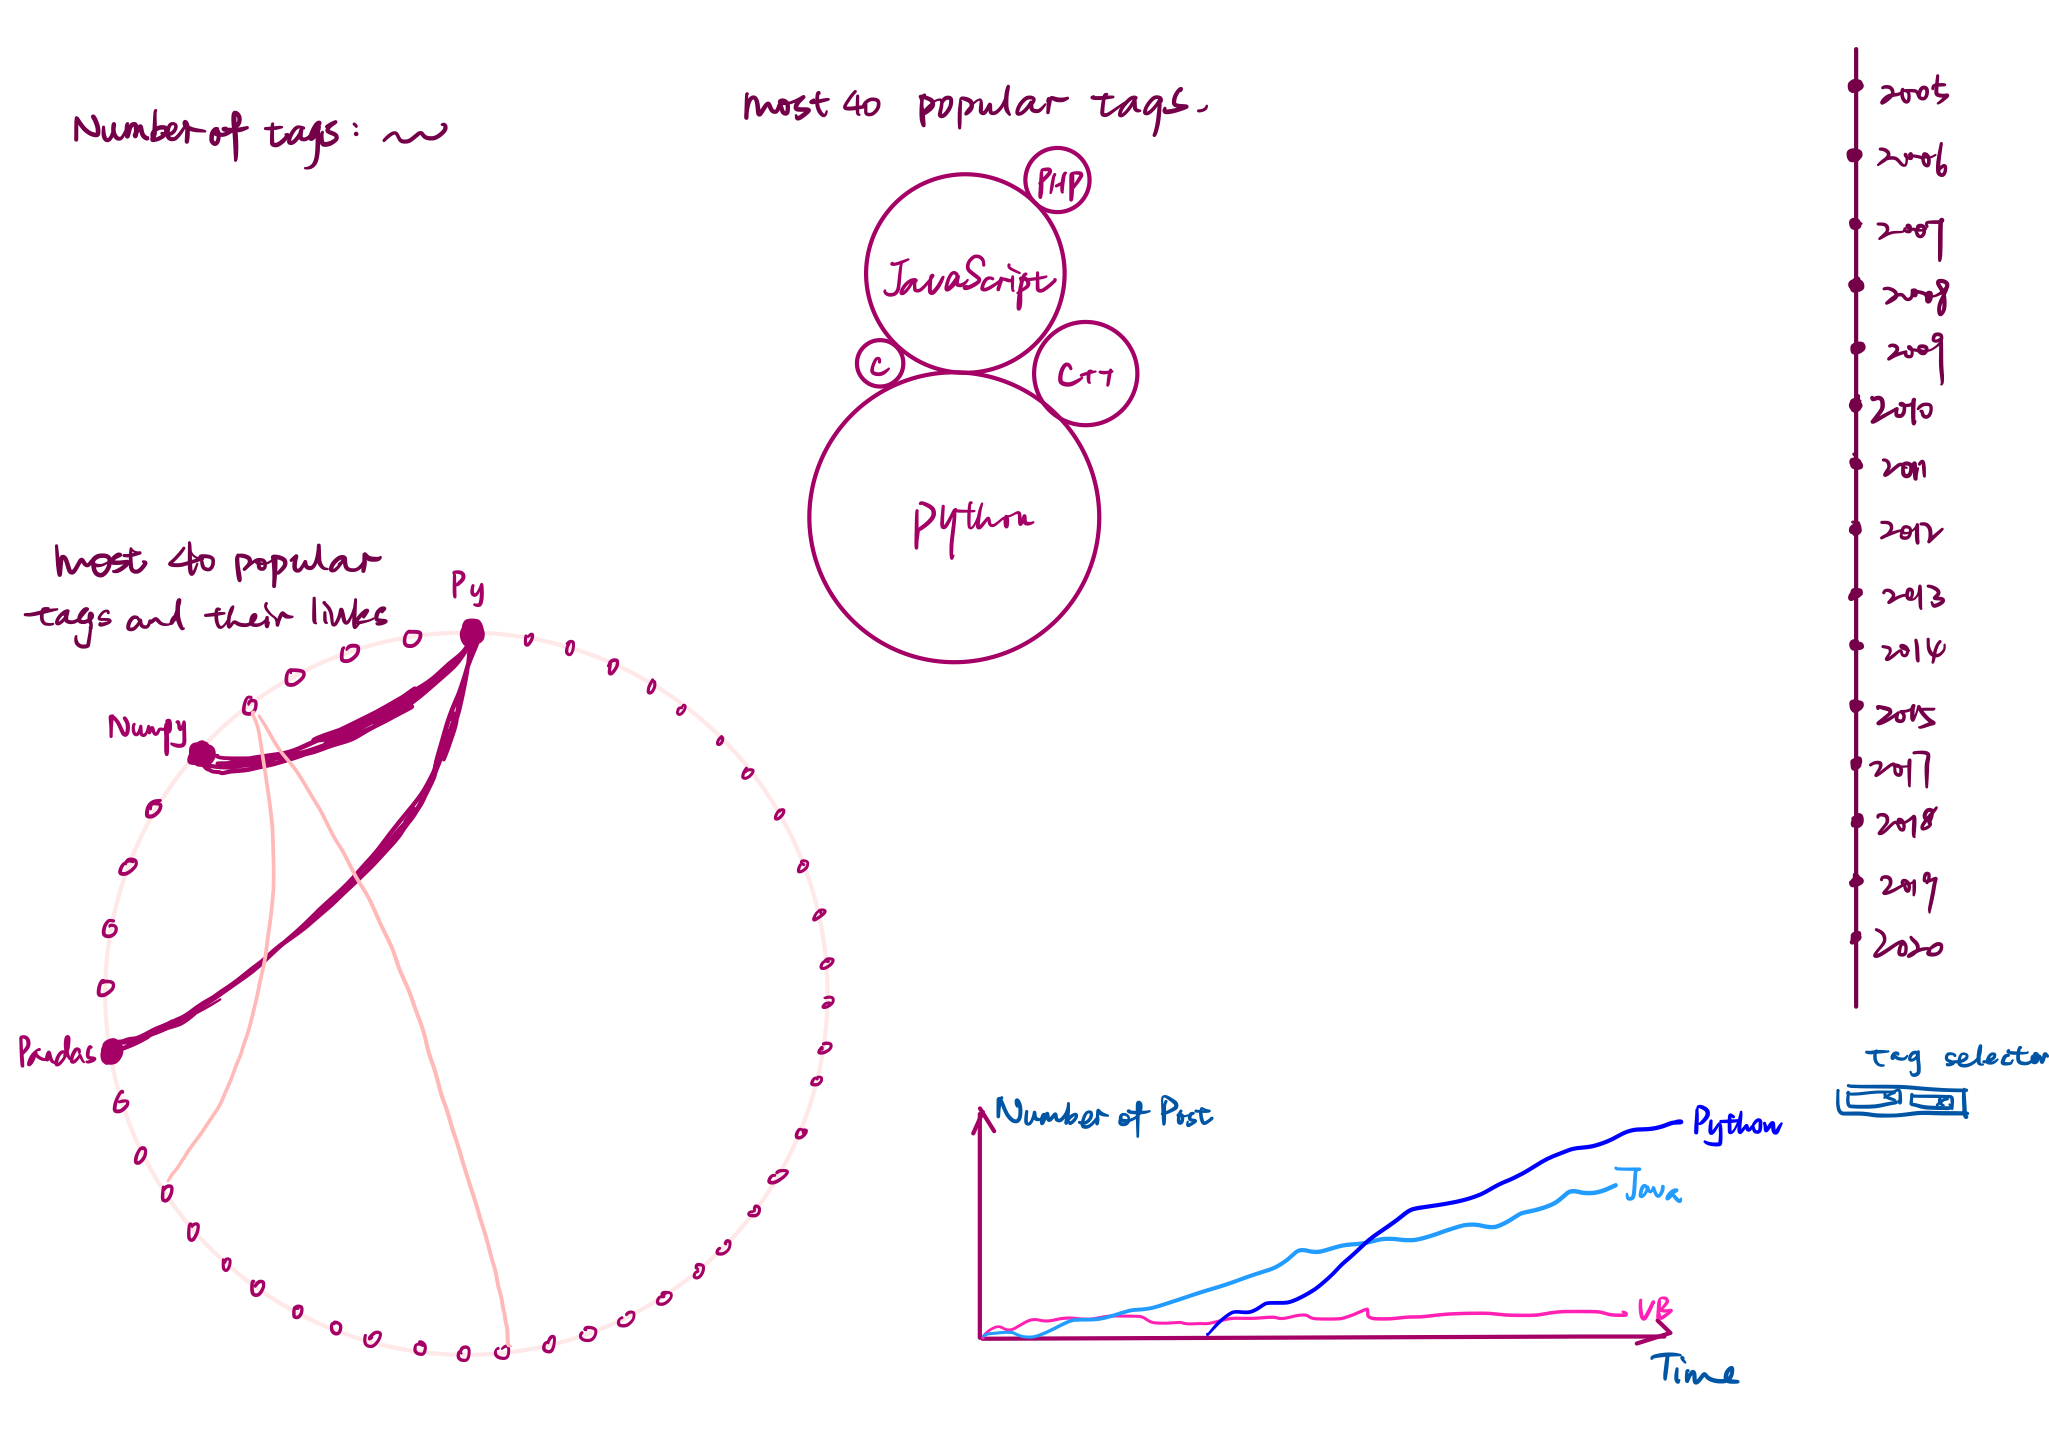
Most popular tags in posts
Visualization : bubble chart
Visual encoding : tag =>color, number of occurrence =>size of circle
Reason : Tags are the entry point of post data, we want to emphasize them.
Tag combinations in posts
Visualization : chord diagram
Visual encoding : tag =>color, tag combination =>connection
Reason : For some posts, only one tag is marked. It is better to consider these posts as self-connected and show the proportion to other combinations involved.
Development of tags over time
Visualization : line chart
Visual encoding : time =>x, number of posts =>y, tag =>color
Reason : We want to show the continuous development of Stack Overflow tags, and line chart is the direct and clear presentation.
Must-Have Features
- The distribution of Stack Overflow users around the world
- The growth of the Stack Overflow users over time
- The most popular technologies suggested by Stack Overflow posts
- The tag combinations associated with those popular tags
Optional Features
- The changes on the users with top level of reputation
- The word cloud of the user profile
- The number of posts contains the popular tags
- The relationship between solved questions and number of tags
Project Schedule
11/16 - 11/23 Milestone 1 due
- Data collected and data processing.
- Basic HTML template and architecture/data flow will be done.
- Update the process book
Task Details
- Flora Sun ’s part: Posts ’data, collaborates with Jing on template.
- Jing Zhang ’s part: HTML template and basic style or layouts.
- Yongcheng Long ’s part: Users ’data, collaborates with Jing on template.
11/23 - 11/29
- Finish the must have features for the users page
- Finish the must have features for the posts page
- Update the process book
Task Details
TBD
11/30 - 12/07 Milestone 2 due
- Adding some optional features
- Update the process book
Task Details
TBD
12/08 & 12/10 Peer feedback
- Collecting feedbacks from peer
12/10 - 12/15 Final project presentation
- Preparing for the presentation, making final change according to the user’s feedback.
12/16 - 01/06 Final project submission & peer evaluations
- Wrap up the whole project and apply it on the server.
- Finish peer evaluations for other teams.